

Map View
The map view in the Assets workspace shows your trailer assets on an interactive map at, giving you a visual overview of asset locations and status across your fleet. You can switch between map types and layers, explore clusters of assets, and view detailed information for individual assets.
[TODO: Screenshot]
Asset markers and clusters
Assets appear on the map as colored markers based on their current status. When assets are close together at the current zoom level, they group into a cluster to keep the map readable.
TODO - Cluster markers
A cluster displays a count showing how many assets are grouped together. The count is broken down by status:
Healthy – assets with no active issues
Warning – assets with minor alerts
Alert – assets with active alerts
Critical – assets requiring immediate attention
Unknown – assets with no recent data
Hover over a cluster to see the status breakdown in a tooltip. Click a cluster to zoom in and expand it. The map pans to the cluster location and adjusts the zoom level to show individual assets where possible.
When the cluster utilization feature is enabled, you can switch the cluster summary between health status and utilization bands.
TODO - Individual assets
When an asset is not part of a cluster, it appears as an individual marker with an asset-type icon when available. Hover over a marker to see a quick tooltip with basic asset information. If utilization is enabled for your organization, the tooltip also shows utilization details.
Click an individual asset marker to open the asset summary panel on the right side of the screen. When selected, the marker combines the selected pin with the asset-type icon. The panel shows detailed information about that asset, including its status, location, recent activity, and a link to view full asset details.
Map layers
Use the Layers control in the bottom-left of the map to customize your map view. Click it to open the layers flyout.
[TODO: Screenshot]
Map type
Switch between the 2 map styles:
Default – a street map view with roads, labels, and landmarks
Satellite – aerial imagery showing the actual terrain
Select a type to apply it to the map. The selected type shows a check badge indicator.
Geofences layer
Toggle Geofences on or off to show or hide geofence boundaries on the map. Geofences appear as shaded regions indicating defined areas such as yards, depots, or customer locations.
When you create or edit a geofence, the map automatically switches to Satellite view to make boundary drawing easier.
Street View
Toggle Street View on to enter Google Street View mode. In this mode, you can explore street-level imagery around your assets.
When Street View is active, the layers control is hidden and a Back to map button appears in the top-left of the map. Click it to return to the standard map.
[TODO: Screenshot]
Street View may show a message if coverage is unavailable:
Zoom in to see Street View coverage.
No Street View imagery was found near this location
No Street View available
Map controls
A set of custom map controls appears in the bottom-right corner of the map for quick navigation.
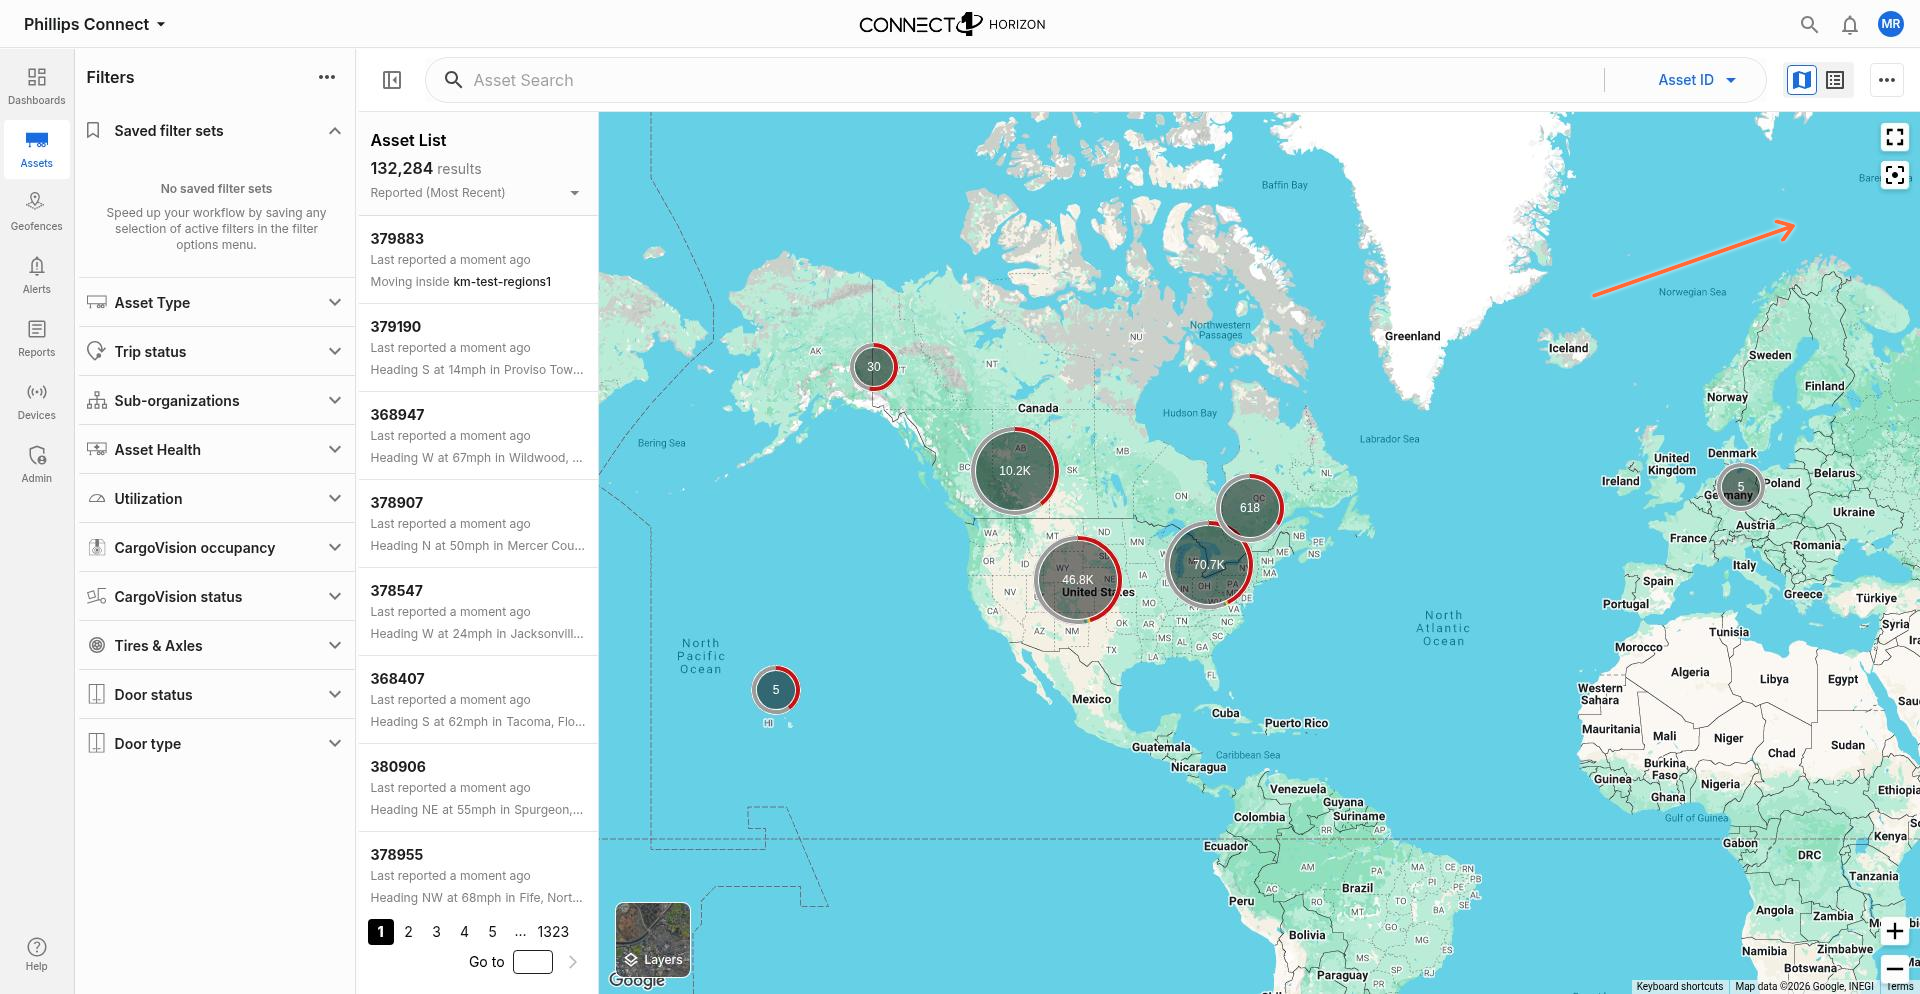
Zoom in and zoom out
Click the plus sign to zoom in and the minus sign to zoom out. The map centers on the current view while adjusting the zoom level. Zooming manually disables the auto-recentering state.
Fullscreen
Click the fullscreen button (square with outward arrows) to expand the map to fill the entire screen. In fullscreen mode, the button changes to a minimize icon. Click it again to exit fullscreen and return to the normal workspace layout.
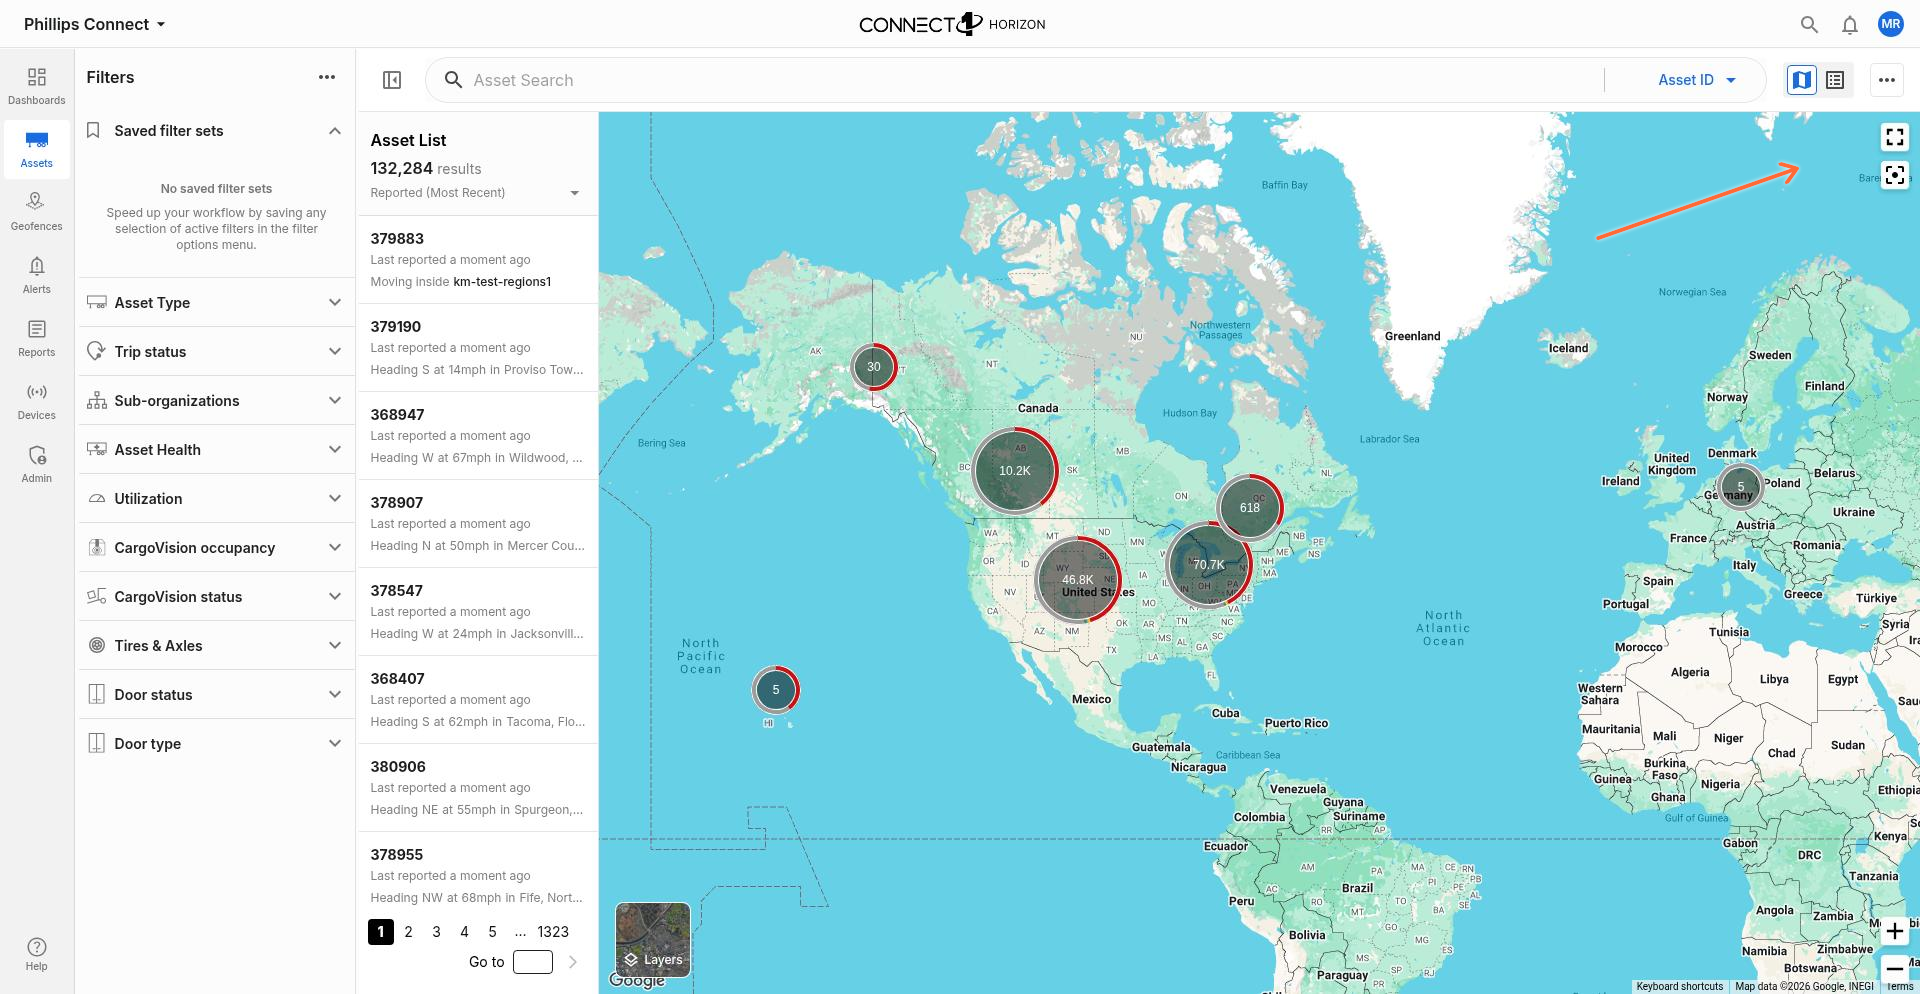
Default view
When the map is panned or zoomed away from the default viewport, a recenter button appears to reset the view to the initial map position and zoom level.
Filters and the map
Any asset filters you apply in the Assets workspace also affect the map view. The map shows the same filtered results as the Asset List and List View, i.e. if you filter by a specific health status and sensor type, the map updates to show only matching assets.
Related articles
Assets Workspace Overview – learn about the full Assets workspace and available views
Asset Search – find specific assets by name, ID, or other attributes
List View – view the same filtered asset set in a list format
Show and hide asset filters – narrow which assets appear on the map using filters
Asset filter types and how to use them – understand available filter options